One evening a friend of mine and I were discussing the possibility of particular musical rhythms toward which humans naturally gravitate. It made sense that people would tend to appreciate certain cycles in music due to the fact that there are so many other regular cycles affecting our day to day lives. It was decided it would be a good idea to clock the BPMs of several songs and chart them to see if any clusters popped up.
After doing the web site for IESintme, I learned of a system of time estimation for tasks called MODAPTS ( MODular Arrangement of Predetermined Time Standards). Each body motion is assigned a predetermined integer, and one tabulates how many of each type of motion is employed in accomplishing a task. The integers are then added and multiplied by a constant 0.129 seconds to arrive at the estimated time cost for the task.
This said to me that, in essence, our natural motion rhythms oscillate with an average period of 0.129 seconds. According to the MODAPTS propaganda, this factor is fairly consistent for all people. We all march to about the same drummer, and this clown is poundin' the skins every 0.129 seconds. Division shows us that this is about 465 BPM. That's really fast. However, if we take every fourth beat (which isn't crazy) this is a comfortable 116.3 BPM. My initial hypothesis was that there would be a strong clustering around this particular BPM.
To clock the BPM of the musical works, I used MacBPM Counter 3.3 by Matthias Zenger. A great program in its simplicity. One clicks in rhythm to music playing, and it calculates the BPM with a stabilization factor. The more off beat you are, the lower the factor. I made it a standard practice to record the BPM of a song only when stabilization surpassed 90%.
Since musically rhythms are the same when multiplied by integer powers of two, BPMs were normalized to the range of 100 <= BPM < 200. I did this to avoid classifying something as (for example) 80 BPM when it was actually 160 BPM.
The works I sampled included:
All in all, this totaled 105 data points. These CDs were semi-randomly selected from my massive collection. I tried to steer clear of purely electronic pieces because those beats tend to be more contrived and unnatural.
Incidentally, doing this project I think I heard the first example of a record scratch (the kind like they use in those "hip hop" records kids listen to) a 2min 28 secs into "I am the Walrus" right after John says "they are the eggmen."
Now for some motherfucking results:
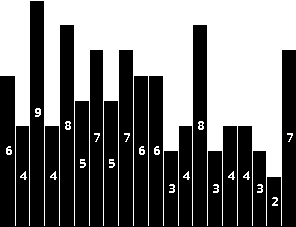
The following chart is a histogram illustrating BPM clusters from 100 to 199BPM in intervals of 5. I apologize for the appearance of the graph. I apparently don't have any stats applications that do histograms, so I was forced to use a program I wrote in 1994 to generate the chart.
Mean: 146.335238 Median: 145 Mode: 198 Standard Deviation: 28.23096
All right, what do I get from this graph? First off, my hypothesis is semi-confirmed in that the highest spike is in the 110 to 115 spot. This is close enough to 116.3 for me because 1) who knows how accurate that MODAPTS constant is anyway, and 2) there could be error in introduced in the process of clocking the BPMs. Also interesting is that there is another spike in the 165 to 170 slot. What is interesting is that 165 to 170 is about 1.5 times 110 to 115.
I'm not sure quite what to make of this deal, but the bars spanning 105 to 155 (the second from left to the 11th from the left) display an odd pattern of ascending for odd bars (4,4,5,5,6), and descending for even bars (9,8,7,7,6). What gives there?
The most interesting result (in my opinion) is the relatively lean amounts of songs in the range from 155 to 195. There is an especially noticeable drop-off in the 190 to 195 bar. You may ask about the spike of 8 in the 165 to 170 range, but I suspect the anomaly is due to the reason previously cited.
If you would like to do some analysis of your own, here is the raw data. Here is the unsorted transcription of the BPMs for the various albums.
I learned a lot about the importance of the role that tempo plays in the overall mood of a piece. Songs could vary drastically in tempo to indicate different movements of a song, other tempos can deviate only slightly to subliminally increase urgency or relaxation (for example, "Smells Like Teen Spirit" by Nirvana shifts from 117 BPM to 119 BPM when going from low to high energy).
Further Research: In a word, plenty. Obviously, the sample set was anything but random. I made no provisions for style of music or, perhaps more importantly, time signature. It would also be nice to see if there are any trends in transitions of BPM between movements.